Nonprofit Resources
Reporting Internal Audit Results to Your Institution’s Board
An effective internal audit process can provide your higher education institution with significant benefits, providing vital insights and recommendations to help you safeguard your institution and resources and make informed strategic decisions. We’ve previously discussed how to develop an internal audit process and perform a risk assessment. Now let’s look at an essential last step: communicating the internal audit results to your board.
The following recommendations and examples will help you develop a clear, effective internal audit report and presentation.
Summarize What Was Tested
Start by discussing how the decision about where to use the institution’s internal audit hours was made. While your board may have been involved in deciding what to test, that initial decision was likely made months earlier. It can be helpful to include this information in the final report as a reminder.
Many institutions include the board and management as a key part of the institutional risk assessment process. If you completed the quantified risk assessment matrix described in this article, include it in the final report to provide a high-level summary of what was tested and why. This matrix provides a valuable snapshot of the institution’s most critical risks by summarizing the key risks identified by area, how these risks could impact the institution, and the likelihood of occurrence.
Explain How Resources Were Used
Include information about how the internal audit resources (hours) were used to focus on the identified risks. One way to show this is to sort your risk assessment data by:
- The risk levels in the risk assessment matrix (critical, high, medium, and low); and
- The number of risks at each level, by area.
Formatting this data into a graph like the one in Example 1 below makes it easier to see which areas pose the most risk to your institution.
Example 1

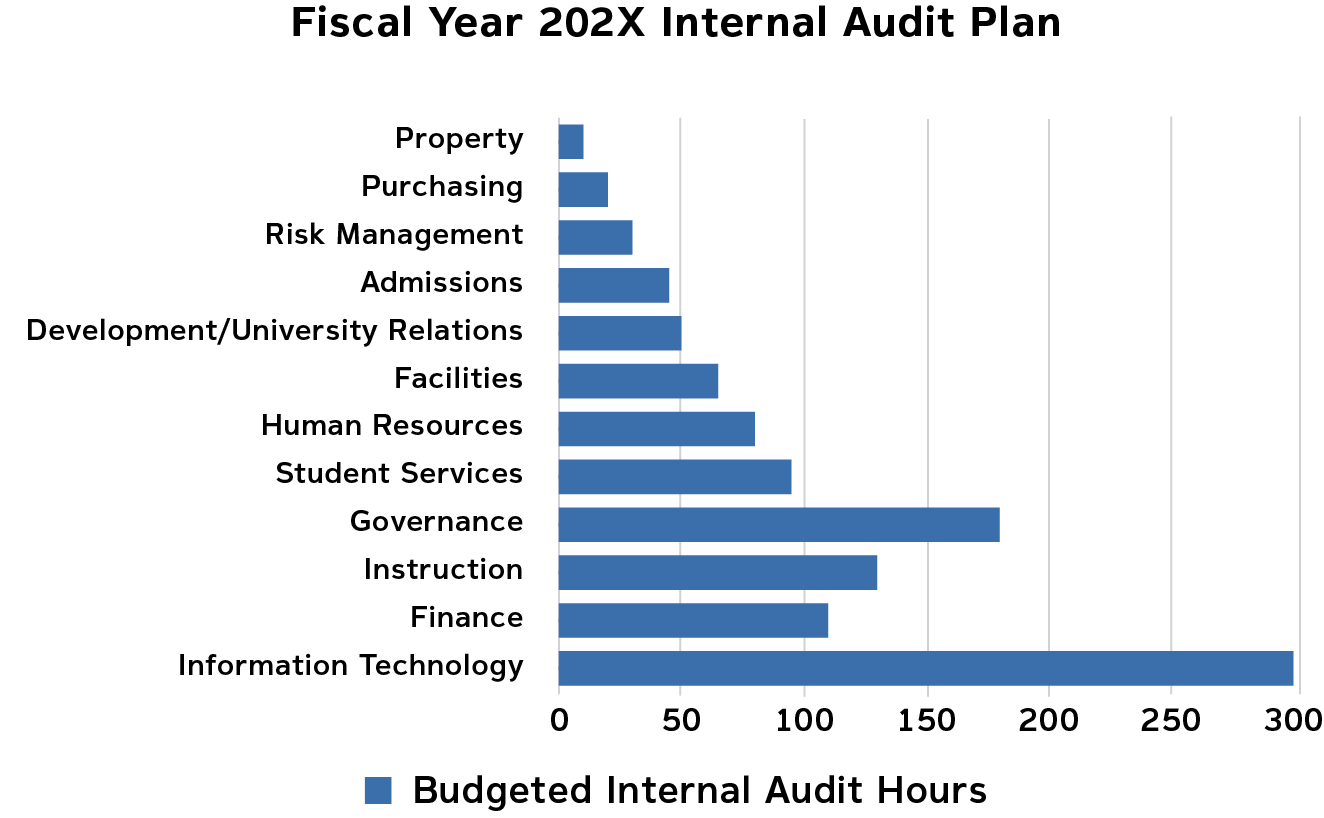
Next, show how the internal audit hours were budgeted to correlate with these risks:
Example 2
While each of these graphs provides key information, we also recommend creating a separate graph that combines the data in the two graphs above as follows:
Example 3

This combined graph makes it easy to cross-reference the number and types of risks with the use of internal audit hours, allowing you to identify whether the risk concentrations correlate with resource utilization. They may not always correlate, as demonstrated in Example 3. When this occurs, it is an important point to discuss with the board.
This analysis will also show your board and management whether you need additional resources to address all the identified risks adequately.
Another way to view institutional risks is to link them to your institution’s strategic initiatives. You can show the percentage of internal audit hours spent on each strategic initiative, as follows:
Example 4

The graphs in Examples 3 and 4 are an exceptional way to demonstrate how your institution is investing its time and resources to address the identified risks.
Summarize the Audit Findings
Prepare to discuss the results of the various engagements performed and the related findings with your board. Common board questions include:
- What is the status of the findings from prior and current audits?
- Are these findings being resolved?
- Are unresolved findings increasing or decreasing?
The graph below does an excellent job of summarizing the answers to these questions:
Example 5

After reviewing this overall summary of the findings, your board should discuss the individual findings and the corresponding recommendations.
The full written internal audit report should be included in the board packet distributed prior to the meeting so board members can review it before your presentation. You may find that the discussion focuses on the critical and high-risk exceptions and not the moderate and low-risk ones, but you can offer to discuss any of those risks if board members have questions or concerns.
Next Steps
End with a discussion about the upcoming internal audits already in process or scheduled for the remainder of the year. This will give the board a chance to redirect resources, if necessary.
Here is one way you can present this information:
Example 6

This chart could be followed by a list of open engagements and the timeline for completion.
We live in a world full of information, which can make it hard to know where to focus. Carefully developing an internal audit presentation that provides your board and management with clear, useful information will help demonstrate the many benefits of internal audits and build continued support and resources for this vital process.
Please contact us with any questions.
Authors: Daniel M. Campbell and Junice Jones
Additional Resources:
Internal Audit in Higher Education Institutions
Performing Risk Assessment in Higher Education Institutions