Nonprofit Resources
With Limited Resources, Nonprofit Financial Data is Key
This article originally appeared on the BDO Nonprofit Standard blog. Copyright © 2017 BDO USA, LLP. All rights reserved. www.bdo.comRunning a nonprofit takes blood, sweat and tears—and a steady stream of funding. Nonprofit Standards, BDO’s first annual nonprofit benchmarking survey, looks closely at the key financial metrics nonprofits should watch to keep tabs on their overall fiscal health.
With nearly half (48 percent) of nonprofits naming cutbacks in funding and drops in revenue as a top concern, it’s clear they’re paying close attention to their revenue streams. Revenue prospects look bright for most nonprofits; over 70 percent experienced an increase in revenue in their last fiscal year.
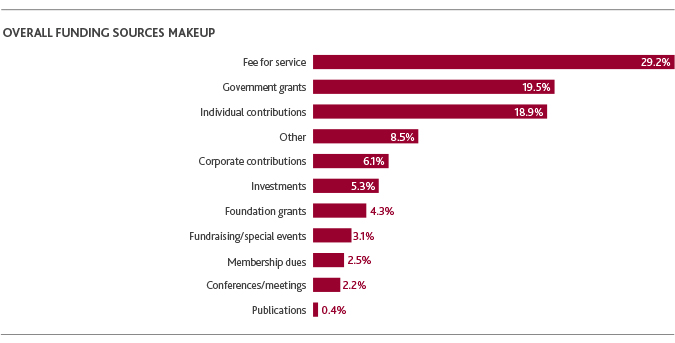
But where does this crucial funding come from? Nonprofits generate funding from a variety of sources (as seen below), with most funding coming from fee for service (29.2 percent), government grants (19.5 percent) and individual contributions (18.9 percent).
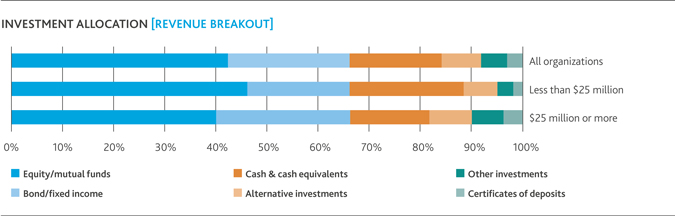
When it comes to how organizations are investing, a clear majority (83 percent) of organizations have a formal investment policy to govern their activities. While it’s common to use a variety of investment vehicles, nonprofits allocate the highest percentage of investments to equity and mutual funds, making up an average of 42.4 percent of total investments. Overall, nonprofits use investment income to fund 7 percent of their operating budgets on average. However, the largest proportion of those surveyed (38 percent) report having no operating budget funded via investment income.
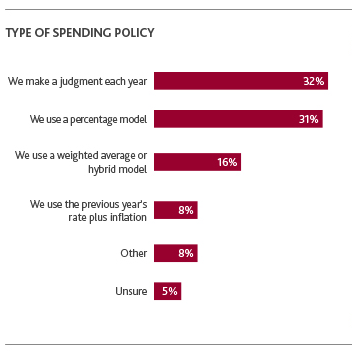
When dealing with limited resources, spending is also closely monitored. A majority of nonprofits (70 percent) have an official spending policy, and the highest proportion of those surveyed (32 percent) make a judgment call each year. This gives organizations the opportunity to remain flexible year-to-year if investment returns don’t meet expectations. Percentage models are the next highest, cited by almost one-third.
Read the operations section of our survey for the full data on nonprofit revenue, funding sources, investments and spending policies. And, see our previous coverage of the survey’s strategic planning section here.