Nonprofit Resources
Analyzing Key Financial Indicators: Debt Ratios and Measurements
We live in a volatile world affected by unpredictable economic fluctuations, natural disasters, and ongoing global conflicts. Churches are not exempt from these challenges, which can impact their finances and their ability to meet debt obligations and carry out their ministry. It’s essential to be financially proactive and prepared.
This article is the second in our series on financial ratios that offer valuable insight into your church’s financial health. In our previous article, we explored the importance of monitoring cash flow ratios. Now, we’ll focus on how to analyze debt ratios, using examples from the CapinCrouse Church Financial Health IndexTM (Index).
You will learn:
· Why monitoring debt ratios is important.
· How to interpret key debt ratios.
· Recommended benchmarks for debt levels.
· How to use debt ratios alongside other metrics for deeper insight into financial trends.
Why Monitor Debt Ratios?
Monitoring debt ratios helps ensure that your financial obligations don’t hinder ministry opportunities. High debt levels may force difficult decisions, such as cutting ministry programs, reducing staff, or delaying expansion to have funds to service the debt.
It’s important to evaluate debt ratios within the context of your church’s overall financial picture. Rather than focusing on a single ratio, consider all financial indicators, including cash flow and liquidity, together to gain meaningful insight.
Debt to Contributions Without Donor Restrictions
This ratio looks at total debt at the end of the year divided by contributions without donor restrictions. Note that it excludes donor-restricted contributions, and some churches may receive contributions that are restricted for debt reduction. The benchmark is 2.0 or less, and anything above 3.0 is a red flag.
Let’s look at some sample ratios with very different results and trends, and what this may indicate for each hypothetical church.
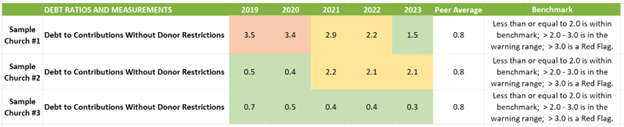
From 2019 to 2022, Sample Church #1 was outside the recommended benchmark of 2.0 or less. In addition to the church’s results compared to peers and the recommended benchmark, you can also review the trend of the ratio between years. The trend here indicates that Sample Church #1 was moving in the right direction between 2019 and 2023, when its result moved below 2.0. This reflects that the church underwent a capital campaign to reduce total debt over a three-year period after the elders and pastors became concerned about the heavy debt load and a potential rate reset in future years.
Sample Church #2’s trend is concerning because debt increased significantly after 2020 and remained at that level. This indicates that there may be underlying issues the church should address, such as a decrease in contributions or a large increase in debt. In this case, the church purchased a new campus and underwent significant renovations, which required debt financing.
Sample Church #3 is within the recommended benchmark in all years shown. The church continues to pay down its debt while contributions increase.
As this shows, the trends, benchmark, and peer information within the ratios reveal more than numbers. You can analyze the data to gain significant insight and determine where to investigate further.
Mandatory Debt Service to Contributions Without Donor Restrictions
This ratio measures the total amount of debt service payments, including principal and interest, divided by total contributions without donor restrictions. In contrast to the ratio above, which shows total debt, this ratio includes interest, which can have a significant negative effect on the results. Let’s look at our examples again:

Similar to the first ratio, Sample Church #1’s results are concerning. However, unlike the first ratio, the church did not reach the benchmark by the end of its three-year capital campaign. This indicates that although the church was able to reduce its total debt load, the debt payments continue to be a significant financial burden. This may be due to a higher interest rate, which would increase the monthly payment. It is important for Sample Church #1’s management and board to understand the impact this is having on the church’s ability to fulfill its ministry and assess steps that could be taken to address it, such as refinancing at a lower interest rate, if possible, or increasing contributions.
Sample Church #2 exceeded the recommended benchmark of 20% after taking on new debt. The church leaders may have considered this before adding debt and have a plan in place to reduce the debt load without impacting ministry. If not, management and the board should develop a plan to reduce the annual burden the debt is causing.
Sample Church #3 shows a very healthy trend. The church’s results are in line with the peer average, and it was able to reduce the amount of contributions going to debt service each year.
The ratio results raise very different questions for these three churches, which is why analysis is vital.
Debt per Giving Unit
This ratio compares debt per giving unit to contributions per giving unit. For the purposes of the Index, we define a giving unit as a household that contributes $250 or more per year to the church. The benchmark for this ratio is under 2.0 x contributions per giving unit, with results greater than 3.0 considered a red flag.

Sample Church #1’s results are very similar to its results for the first ratio as the church continues to pay down its debt balance. The green in 2023 is a positive sign, but further work is required to improve the result.
This ratio is another signal that Sample Church #2 needs a plan to reduce its debt load. The level of debt the church is carrying could disrupt programs and prevent the church from pivoting as needed to address changing economic conditions. A strong plan can help the church be nimbler and leaner.
Sample Church #3’s results are strong and above the benchmark in every year shown. When we compare this ratio to the other debt ratios and measures, Sample Church #3’s financial results do not raise concerns.
Final Thoughts
Monitoring debt ratios can help ensure your church is not overextended and that financial decisions support, rather than hinder, your mission. Analyzing these ratios can also uncover issues that need attention, guiding your church leadership toward wise, proactive stewardship.
If you are unsure where to start in benchmarking your church, ask us about the CapinCrouse Church Financial Health Index. This convenient online tool is designed to help churches measure and analyze their financial strengths, identify areas for improvement, spot important trends, and map the best route forward.
This article has been updated.

Nathan B. Davis
Nathan Davis is a Partner at CapinCrouse. He has almost 15 years of experience providing auditing* and accounting services to various nonprofit entities, including churches and denominational entities, colleges and universities, private schools, and international mission organizations. He is responsible for the oversight of attest* engagements, the recommendation of internal control structures and best practices, and ensuring that the team is communicating well with client personnel to facilitate efficient and effective service.